Insight
What America's 45 per cent copper import reliance actually measures
The most quoted figure in American copper is a fraction with three terms in it. Every one of them is refined metal. Rebuilt from the components the survey publishes in the same table, it says something narrower, and more useful, than the way it is normally used.
In short
01- The United States relied on net imports for an estimated 45 per cent of its refined copper consumption in 2024, according to the United States Geological Survey.
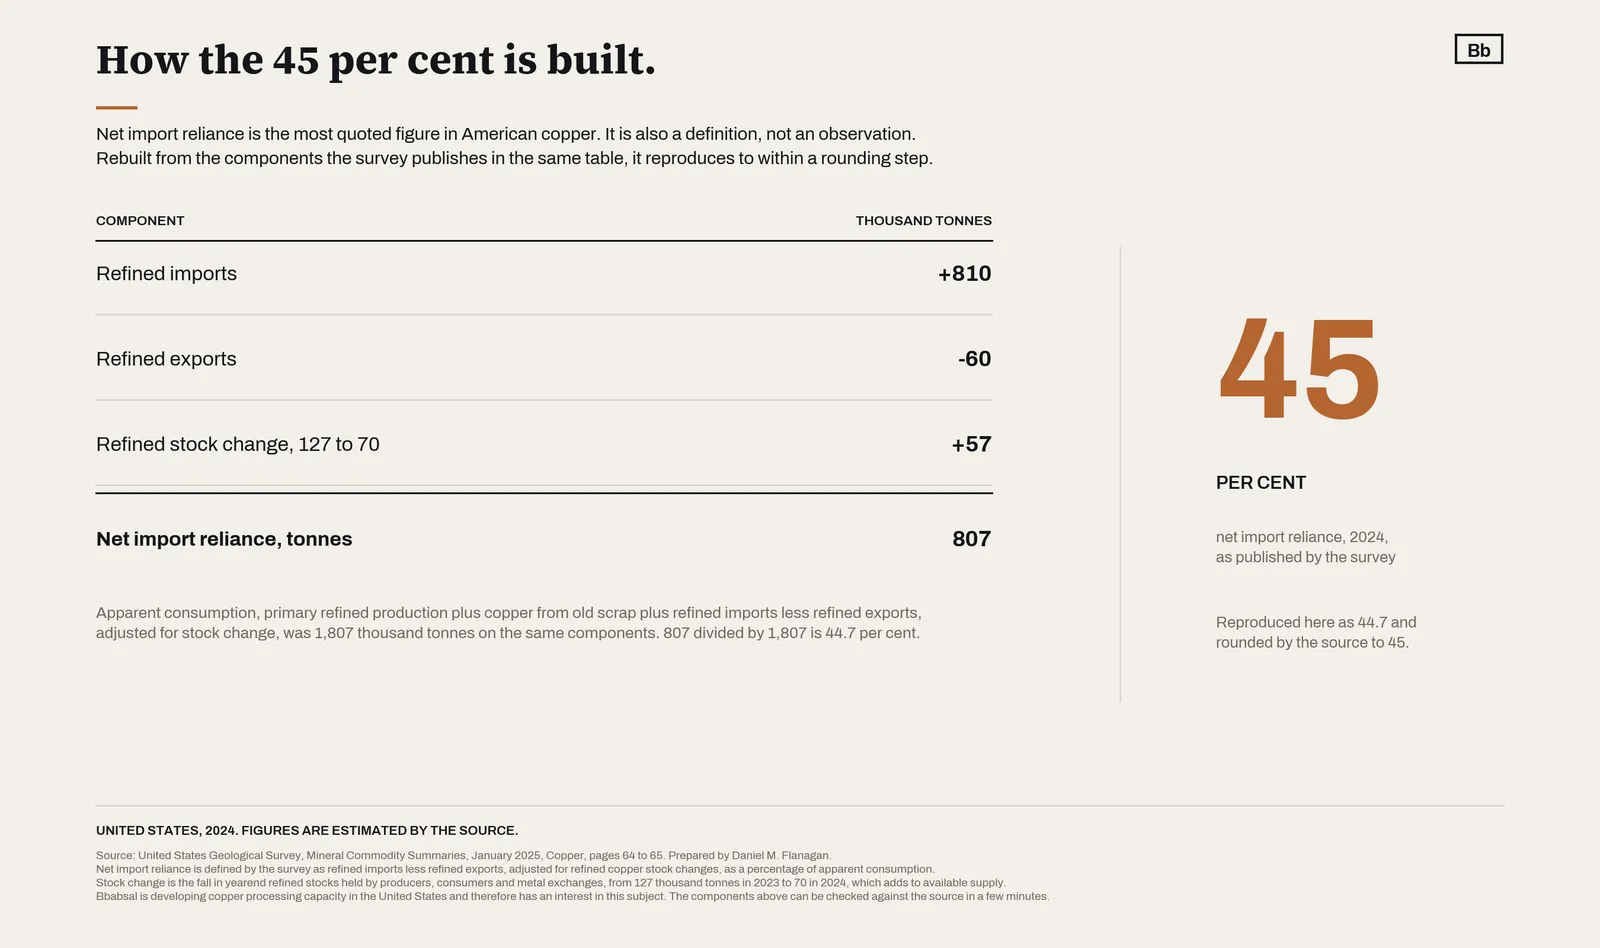
- The numerator of that fraction is 807 thousand tonnes: 810 imported as refined metal, less 60 exported as refined metal, plus a 57 thousand tonne draw on refined stocks. The denominator is apparent consumption of 1,807. That is 44.7 per cent, which the survey rounds to 45.
- Nothing in either term is ore or concentrate. Mine output does not enter the figure at any point. What moves it is the capacity to turn ore into metal inside the country, and the trade in metal itself.
- Hold the denominator and remove the stock adjustment, and the same year reads about 41.5 per cent, which is where the survey puts 2022 and 2023. The step up to 45 is, arithmetically, the stock draw.
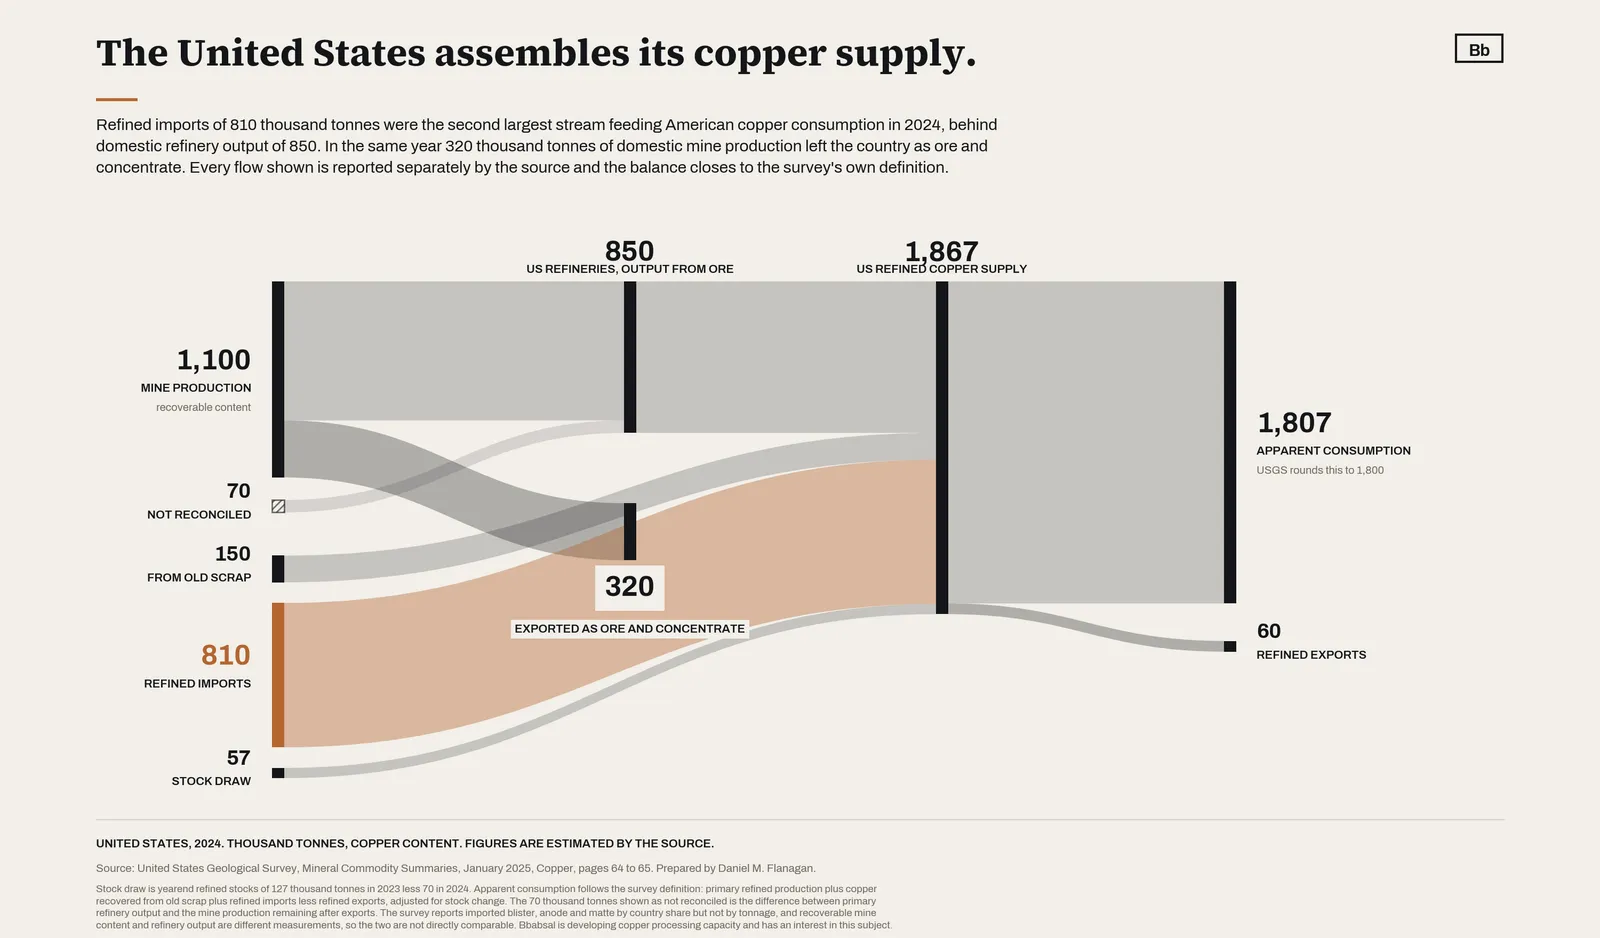
- In the same year, an estimated 320 thousand tonnes of American mine production left the country as ore and concentrate.
What the figure is made of
02The figure everyone quotes
Net import reliance is the number that appears in almost every argument about American copper. It is cited in support of permitting reform, of tariffs, of stockpiling, and of new mines. It is a real figure from a serious source and there is nothing wrong with it.
There is something wrong with how it is used. It is a definition before it is an observation, and almost nobody shows its components.
What the survey defines
The United States Geological Survey publishes net import reliance for refined copper as refined imports less refined exports, adjusted for changes in refined copper stocks, expressed as a percentage of apparent consumption. Apparent consumption on the same page is primary refined production plus copper recovered from old scrap plus refined imports less refined exports, adjusted for the same stock change.
Both sides of the fraction are therefore measured in refined metal. That is the whole of the finding, and it takes a table to see it.
For 2024 the survey gives, in thousand tonnes of copper content and all estimated: refined imports 810, refined exports 60, yearend refined stocks of 127 in 2023 falling to 70 in 2024, primary refinery production from ore 850, copper recovered from old scrap 150, and apparent consumption rounded to 1,800.
Those components reproduce the published figures. 850 plus 150 plus 810 less 60 plus 57 is 1,867 available, less nothing further, giving apparent consumption of 1,807 on the survey's own definition, which it rounds to 1,800. The numerator, 810 less 60 plus 57, is 807. And 807 divided by 1,807 is 44.7 per cent, which the survey rounds to 45.
This is not a correction of the survey. It is the survey, arithmetically intact, with its parts visible.
What the components say
A number made only of refined metal cannot be moved by ore.
Open a new mine and, on the survey's definition, nothing in this fraction changes until the material that mine produces is converted into metal inside the United States. If the concentrate is shipped out instead, the mine raises domestic production and leaves net import reliance where it was. If the metal comes back, it enters the fraction as an import.
That is not a hypothetical sequence. In 2024 the country exported an estimated 320 thousand tonnes of copper as ore and concentrate while importing an estimated 810 thousand tonnes as refined metal, according to the same survey table. The first figure never touches net import reliance. The second one is most of it.
The part of this that cuts the other way
The stock adjustment deserves more attention than it usually gets, because it works against the alarming reading of the headline.
Of the 807 thousand tonne numerator, 57 came from drawing down refined stocks held by producers, consumers and metal exchanges, from 127 thousand tonnes at the end of 2023 to an estimated 70 at the end of 2024, per the survey. That copper did not cross a border in 2024. It came out of a warehouse.
Hold the 2024 denominator fixed and take the stock adjustment out, and the ratio is about 41.5 per cent. The survey puts 2022 at 41 per cent and 2023 at 41 per cent. On that arithmetic the widely noted rise to 45 per cent in 2024 is the stock draw rather than a deterioration in the trade position.
Two honest limits on that. This is a decomposition of one year, holding the denominator constant, not a counterfactual about what trade would have been. And the equivalent components for 2022 and 2023 were not extracted in this pass, so those years are not decomposed here and may contain stock effects of their own. Anyone wanting to test it has the same public table.
A company developing copper processing capacity has an obvious interest in the 45 per cent being read as a crisis. It is worth saying plainly that one year of it is inventory.
Five years of the same trade
The stronger evidence is not the level in any single year. It is the constancy.
Between 2020 and 2024 the survey records exports of copper as ore and concentrate every year, inside a narrow band: 383 thousand tonnes, then 344, 351, 339, and an estimated 320. Over the same five years refined imports rose from 676 to an estimated 810. Primary refinery production from ore ended close to where it began, 872 in 2020 against an estimated 850 in 2024.
A single year can be an anomaly. Five years of the same trade, in the same direction, at broadly the same size, is a configuration. Material leaves as concentrate and returns as metal because that is how the system is currently arranged, not because of a shortfall that a good year would close.
The distinction decides where capital and policy should go. A shortfall closes when supply increases. An arrangement changes only when something is built.
What this does not settle
One balance in this data does not close, and the figure says so on its face rather than hiding it.
Mine production of an estimated 1,100 thousand tonnes less exports of 320 leaves 780 available for domestic conversion, against primary refinery output from ore of an estimated 850. The residual of 70 is not an error in either number. The survey reports imported blister, anode and matte by country share but not by tonnage on that page, so that inflow cannot be quantified from the published table. Recoverable content of mine production and refinery output from ore are also different measurements and are not directly comparable.
The Sankey therefore shows that 70 hatched and labelled as not reconciled. An analyst who checks will find it labelled before they find it themselves, which is the point of publishing it that way.
What would change this view
Three things, named in advance.
The January 2026 edition of the survey will revise the 2024 estimates, and several of the figures above are estimates rather than reported values. If the stock series moves, the decomposition above moves with it.
If the survey, or a filing, put a tonnage on imported blister, anode and matte, the ore to metal residual could be closed and the flow diagram would gain a stream it currently cannot draw.
And if the components for 2020 to 2023 were extracted at the same level of detail, the five year comparison could be decomposed rather than described. That work has not been done here and is not claimed.
Where the constraint sits
For a policymaker, the practical consequence is that a measure which increases mine output should not be expected to move net import reliance for refined copper, because the figure does not contain ore. Measures that change conversion capacity inside the country do. These are different policy instruments with different timescales and they are frequently argued for using the same statistic.
For an investor, the consequence is that the conversion step is where the position in this chain is decided. The survey records the United States refining an estimated 890 thousand tonnes in 2024 against a world total of about 27,000, of which China accounts for an estimated 12,000. That concentration is a structural fact about where metal is made, not a forecast.
And for a producing country, the same arithmetic reads from the other end. A country that exports concentrate exports the value of the conversion step with it. That is as true on the Central African Copperbelt as it is in Arizona, and it is the reason value addition is a live policy question in Zambia rather than a slogan.
Copper's binding constraint is not always what comes out of the ground. Sometimes it is what can be done with it afterwards, and in the American numbers for 2024 that is what the most quoted figure is actually measuring.
Method and sources
03Declared interest. Bbabsal holds exploration licences on the Zambian Copperbelt and is developing copper processing capacity in the United States. It therefore holds a commercial interest in the conclusion that conversion capacity is the constraint, and that interest should be weighed by the reader.
Two offsets are offered instead of an assurance. The section on the stock draw argues against the strongest version of our own position. And every component of every figure used here comes from one public page, published in the dataset alongside this piece, so the arithmetic can be rebuilt by anyone in a few minutes.
Method note. All figures are thousand tonnes of copper content unless stated. Figures for 2024 are estimates published as such by the survey. Figures for 2020 to 2023 are reported values in the January 2025 edition.
The January 2020 edition of the survey was not retrieved for this piece, so figures for 2015 and 2016 that appear in earlier Bbabsal material are deliberately not used here and remain unverified.
Rounding follows the source. The survey publishes 45 per cent and 1,800; the components reproduce 44.7 per cent and 1,807, and both are shown so the difference is visible rather than silent.
Bbabsal operates in United States dollars. No currency conversion arises in this piece.
01
United States Geological Survey, Mineral Commodity Summaries, January 2025, Copper, pages 64 to 65. Prepared by Daniel M. Flanagan. Retrieved 17 August 2026. pubs.usgs.gov/periodicals/mcs2025/mcs2025-copper.pdf
02
Bbabsal, The United States mines more copper than it refines, 7 August 2026. The prior piece this analysis extends. Not used as a source of figures.
03
data_us_copper_2024.csv, published with this piece. Every figure with its basis, edition and page.
Corrections to this insight will be published here with the date attached. Bbabsal has no declared mineral resource or reserve, and nothing in this insight relates to ground the company holds. Nothing here is an offer of securities or investment advice.